Originally posted here.
At Teachers Pay Teachers, we take performance seriously since it is widely accepted that performance delights users, increases Search Engine rankings and improves conversion rate. In this post, we’ll talk about how we reduced our product page upper 90th percentile response time from 120ms to 20ms.
To begin, you should take a look at an example product page and note the types of information displayed. We use a relational database so this information is normalized and stored across a number of different tables. Therefore, the majority of the information required for the page is only dependent on the product ID. To render the page, we need to make several queries into these tables based on ID (starting these queries is not dependent on the results from previous queries). Our initial implementation didn’t take advantage of this normalization by ID and sequentially queried every table:
items = Item.by_ids(ids)
seller_ids = Enum.map(items, &(&1.user_id))
user_stats = UserStats.user_stats_map(seller_ids)
favorites = Favorite.favorites_map(seller_ids)
stores = User.stores_map(seller_ids)
# more queries...

Enum.map(items, fn item ->
    %{
      item: item,
      user_stats: Map.get(user_stats, item.selller_id),
      is_favorite: Map.get(favorites, item.id),
      store: Map.get(stores, item.seller_id),
      # more Map.gets
    }
  end
)
While the average performance of this code block wasn’t terrible, if any of the queries performed slowly it prevented other queries later in the sequence from even beginning. During performance testing we discovered our mean and upper 90th response times for this endpoint were unacceptably slow.
Before launching this broadly, we were fortunate enough to work closely with Chris McCord. We asked him for architectural advice in optimizing this critical code path. We landed on a pattern that would utilize Task.Supervisor to perform all of these queries in parallel.
First, we added a named Task.Supervisor to our supervision tree to ensure that we’d be able to gracefully handle child process crashes and results.
children = [
  # other children
  supervisor(Task.Supervisor, [[name: TptApi.TaskSupervisor]]),
]
Supervisor.start_link(children, opts)
We were now able to confidently spawn processes using Task.Supervisor.async. This enabled us to parallelize our sequential queries into this:
items = Item.by_ids(ids)
seller_ids = Enum.map(items, &(&1.user_id))

[]
|> get_user_stats(seller_ids)
|> get_favorites(seller_ids)
|> get_stores_by_user(seller_ids)
|> # more queries
|> Task.yield_many()
|> Enum.reduce(%{}, fn ({task, reply}, acc) ->
     case reply do
       {:ok, result} -> Map.merge(acc, result)
     end
   end)
|> generate_product_results(items)
This is pretty dense, so let’s walk through exactly what’s happening:
[]
|> get_user_stats(seller_ids)
This creates an empty array and pipes it to get_user_stats. get_user_stats is responsible for spawning a new Task to query the database and adding that Task to the empty array. Here’s get_user_stats:
def get_user_stats(tasks, seller_ids)
  [Task.Supervisor.async(TptApi.TaskSupervisor, fn ->
    %{user_stats: UserStats.user_stats_map(seller_ids)},
  end) | tasks]
end
Each function in the pipeline behaves similarly. It creates a Task, appends that Task to a list, and pipes along the list. Let’s take a look at the next step of the pipeline:
[]
|> get_user_stats(seller_ids)
|> get_favorites(seller_ids)
As you might expect, get_favorites creates a new task and appends it to the existing array of tasks:
def get_favorites(tasks, seller_ids)
  [Task.Supervisor.async(TptApi.TaskSupervisor, fn ->
    %{favorites: Favorite.favorites_map(seller_ids)},
  end) | tasks]
end
We were repeating [Task.async | tasks] in all of the helper functions and also wanted to add error handling and instrumentation to each task. We abstracted the repeated functionality into another helper function. If you’re interested in the details, let us know in the comments and we can write a follow up post about it!
Once the array of Tasks is populated we block and wait until all queries are complete. (disclaimer: this means we’re still bound by the slowest query!) Task.yield_many is the perfect solution to this problem as it waits until all Tasks are complete before moving on in the pipeline.
Once all queries are complete, we loop over the results with Enum.reduce and merge them together in this step:
|> Enum.reduce(%{}, fn ({task, reply}, acc) ->
     case reply do
       {:ok, result} -> Map.merge(acc, result)
     end
   end)
See the Task.yield_many example for more information.
Finally, we pipe this Map with all of our database data to generate_product_results(items) which does some minor manipulations with the result. Voila!
This technique allows us to easily instrument each individual Task. Granular instrumentation has been vital in our bottleneck improvement efforts. Here’s our current graph in Grafana:
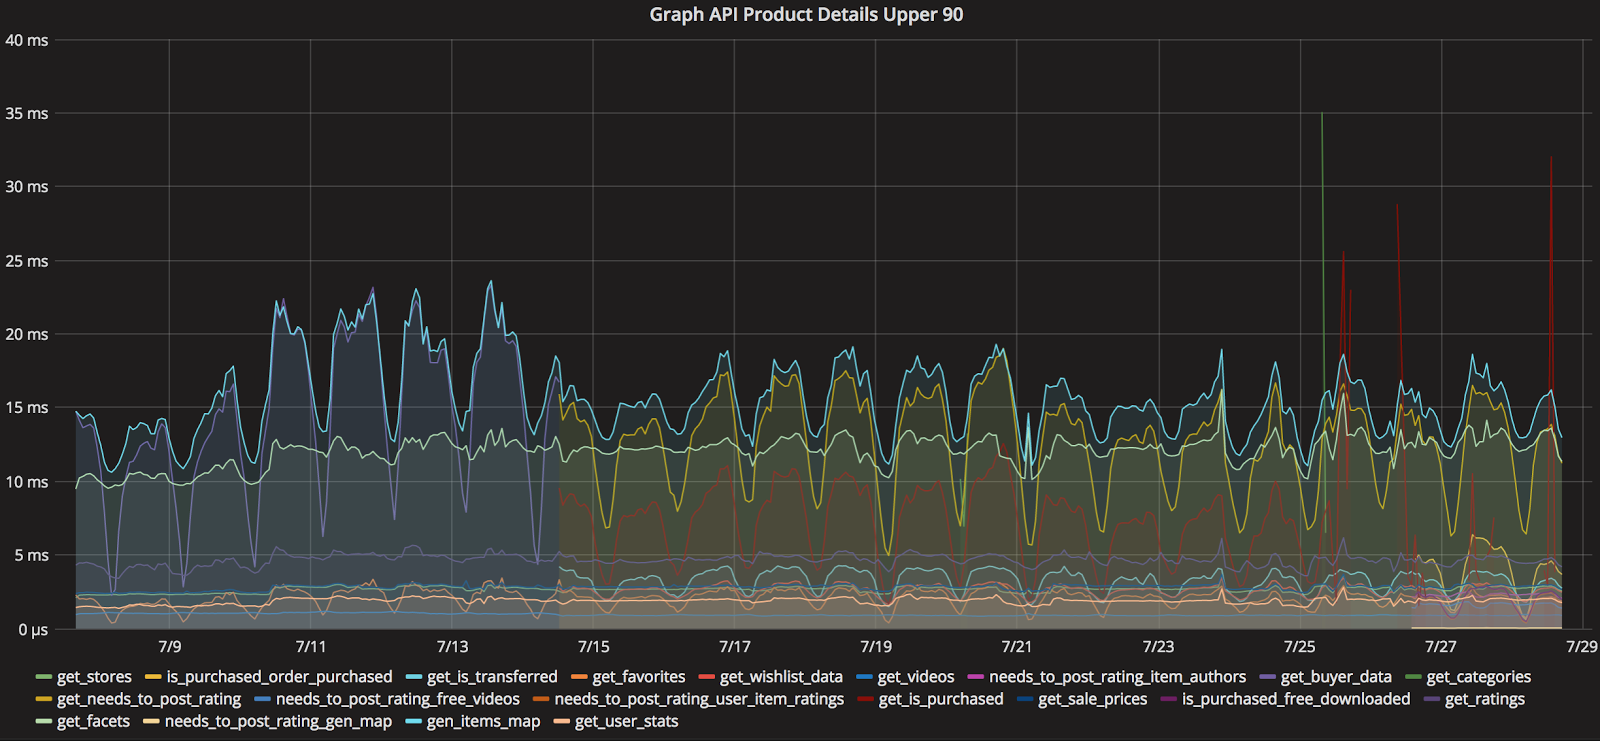
Each line in this graph represents an asynchronous parallel query. Therefore, the total time taken is approximately equivalent to the tallest line. If the queries were sequential, the total time would be approximately the sum of all lines
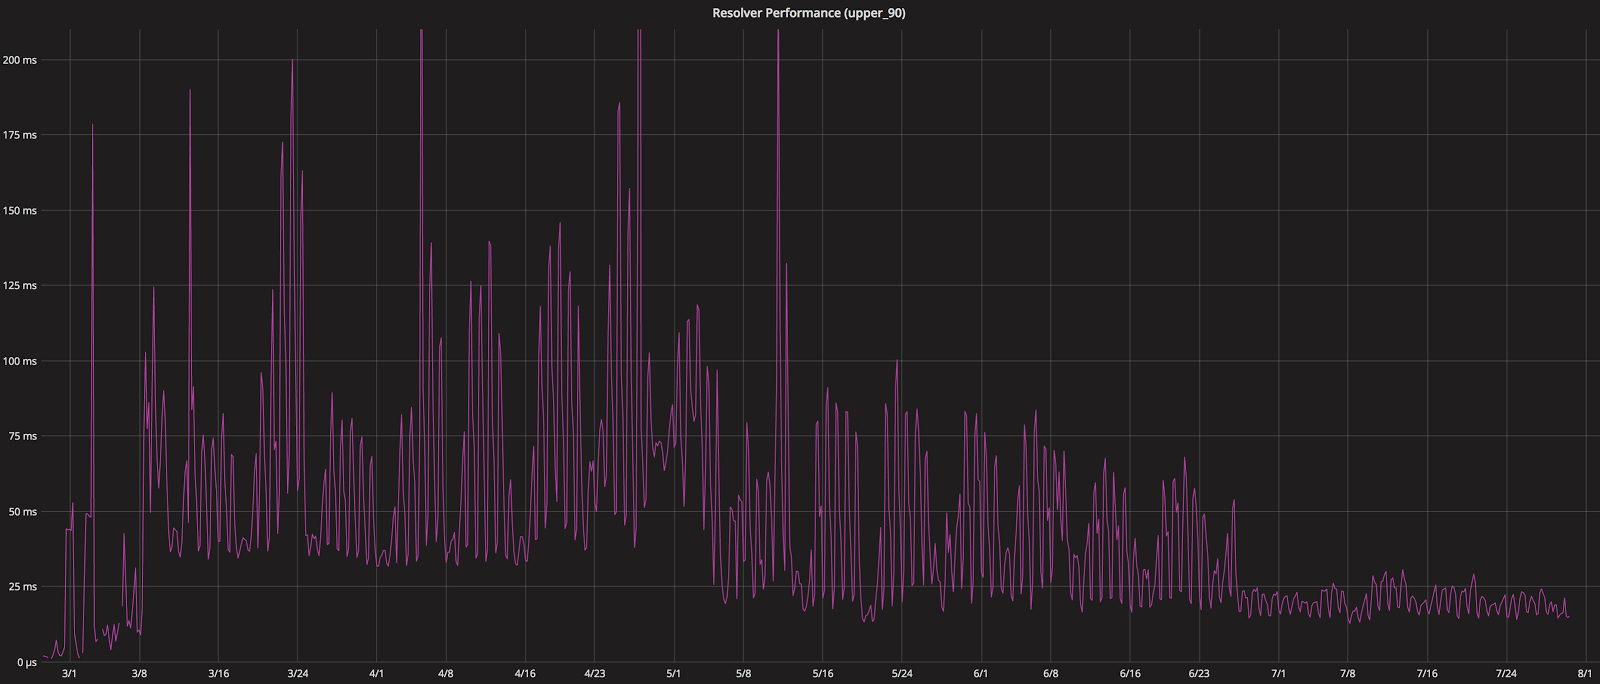
All of this performance optimization has helped us improve the performance of the page! Here’s proof that we’re continually getting faster over time:
For more performance optimizations, check out my post about front-end performance!